
Plan, Track, Measure and Control Like You Never Could Before
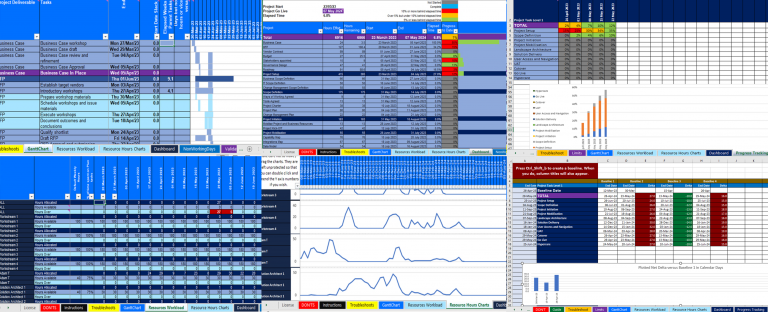
Proper Plan helps project managers to be more effective in controlling and managing their plan and project, and delight their stakeholders with insightful project snapshot dashboards and comprehensive historical tracking charts and data, all effortlessly automated. You and your stakeholders can be confident the project is in safe hands. It’s designed to be a pleasure to work with and not a wrestling match.
What is it?
Proper Plan is an MS Excel-based project planning solution. It is no ordinary Excel template and so do not be under the illusion its level of sophistication cannot match its rivals or meet your needs. In a number of areas, especially usability and tracking and reporting, it arguably leads the way. And you can acquire it for as little as £8 a year. Check it out and if you think there are things it can’t do that you really need, we’d love to hear from you.

We Feel Your Torment
MS Project and other similar desktop or SaaS solutions tend to do a lot more than most project managers need in terms of breadth of functionality, but:
- Don’t get all of the critical and fundamental elements right.
- Deliver unexpected results that you need to fathom and correct.
- Corrupt resource hours and therefore utilisation data.
- Are only shareable with others that have the license, or you must export it to a PDF or paste to MS Excel, neither of which are particularly satisfactory or efficient.
And do you find yourself exerting considerable effort to generate the tracking, measurement and reporting that you and your stakeholders rely upon? Valuable time at the expense of more value-add activities to keep your project on the rails and thriving.
We Set You Free
Unlike those other solutions, even with the sophistication and rich functionality, Proper Plan puts YOU in control of your plan, not your plan in control of you. The formulas and workbook structure are highly sophisticated and deeply thought out, but the maths is relatively simple and predictable.
It also enables you to easily share it with your wider team and stakeholders, without them needing access to any software other than MS Excel, which of course most of us have. It’s a special kind of license, an innovation within Proper Plan purposefully to render it more usable for what it’s designed for. It makes a big difference to how practical it is to use in a wider project team and especially in large organisations.
And don’t forget that effortless project health dashboard and progress tracking and reporting in both data and chart formats, to delight your stakeholders and inspire their utmost confidence in you and your team.
A Pleasure to Work With
Here are some standout features, explained in more detail in specific sections lower down:
- As said, built in MS Excel, a further benefit of which is that anyone that can navigate around spreadsheets will become familiar with Proper Plan and be able to use it very quickly.
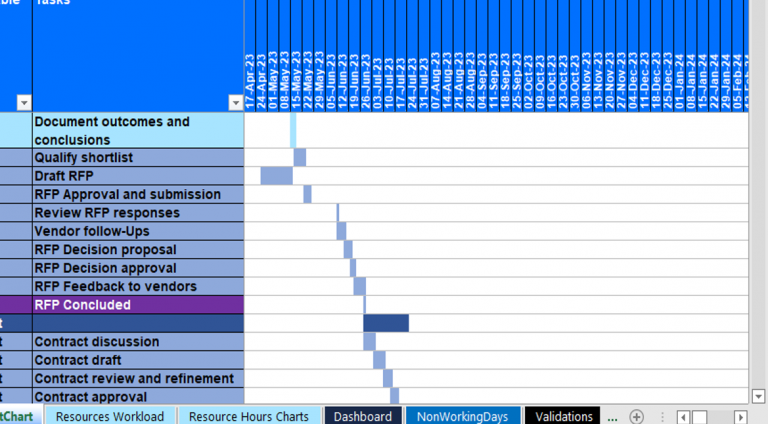
- Easily link multiple plans together with shared dependencies. This you can’t do with desktop MS Project, and can’t do easily with plenty of other solutions. In my experience this has been a painful gap for organisations managing many inter-connecting projects.
- Quickly identify and address peaks and troughs in resource workload in real-time, with absolute clarity in terms of what the maths is doing, something that cannot be said for certain other leading solutions.
- Assign teams with a configurable split of resources to tasks, and have the work included in their individual resource utilisation figures. No more adding lots of resources to one task or repeating tasks unnecessarily.
- An automatically calculated, real-time dashboard to keep your team and stakeholders informed and provide them with insightful decision support. And because it’s in Excel, you can build out your own reporting to meet your internal or external clients’ and project’s needs.
- If you follow the prompt and run a macro once a week (takes a couple of seconds), build the history of the dashboard for each week at total and task levels 1 and 2, so that you can delight your stakeholders with the weekly change in % progress and status, with data and chart outputs. If you enter and update qualitative commentary each week, it copies that into your Progress Tracking history as well.
- Another delight for your stakeholders, create a baseline in a second for overall and task level 1 up to 30 times and automatically track the deltas and ongoing schedule fluctuation over the duration of the project
- Delivered with a comprehensive, over 700 lines sample plan for an end-to-end enterprise solution transformation, which helps you to understand the tool AND may be a useful input for your plan content.
- Drive your entire plan from one single manual start date using the various attributes of tasks, including up to four dependent tasks, enabling speedy update, tracking and identifying of scheduling or resource issues.
- Guidance at your fingertips in all of the columns and rows where it’s warranted, so you can get to grips in no time, plus a trouble-shooting guide to fix most of the few possible problems you might encounter when using it.
- Non-working days are configurable in seconds.
Peace of Mind

Learning a new software solution can be irksome and time-consuming. We’ve done everything we can to address this:
- As said, it’s built in a tool that most project managers will already be familiar with.
- There’s a comprehensive guide that isn’t heavy because it doesn’t need to be.
- There are also some warnings about what not to do and some troubleshooting tips so that you can likely solve any problems that might arise quickly yourself.
- Throughout the workbook there are copious guidance notes at your fingertips to tell you or remind you what a column is for and how to use it.
- There are numerous automated field validation warnings that immediately flag if there’s something you need to address, and you’re guided as to what you need to rectify.
- There’s support available in the unlikely event you need it, and with the most cost-effective license packages, it’s free for the first month.
Obviously there’s expense, sometimes significant, in buying new software, and a risk you might decide it isn’t what you wanted. Again we have endeavoured to address this:
- There’s a generous 60-Days free trial so that you can deeply familiarise yourself with Proper Plan and make sure it’s for you.
- The price is, frankly, extremely low. We don’t want price to be a barrier. We want lots of Project Managers to fill their worlds with delight.
A Project Planning Solution That Works Like Clockwork
Read on for a more in depth look at some of Proper Plan’s standout attributes…
Real-time dashboard
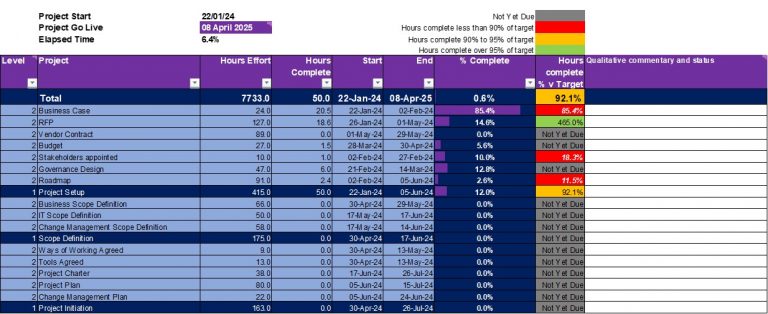
The dashboard tab is a real-time rendering of project health, with an automated Red, Amber, Green status for task levels 1 and 2 and the overall project. It compares percentage complete with target hours complete to date for each category and scores them red for more than 10% behind , amber for between 5% and 10% behind and green for more than 95% of target hours to date complete. The only required setup is some numbering of the task levels in the Validations tab.
It also provides a bar graph representation of percentage complete, because some stakeholders love simple visuals more than they love numbers.
Progress Tracking
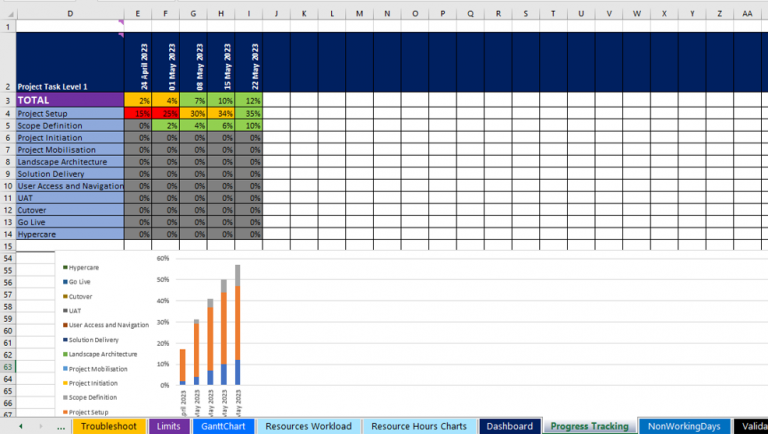
When you follow the prompt and take the couple of seconds to run a macro once a week, you’ll build a granular week-by-week history of your dashboard, compiling the percentage complete, status data history AND any qualitative commentary you chose to add, into table and chart form, so that now you can effortlessly preempt those leadership and stakeholder questions about how you’re tracking, not just where you are now.
Workload breakdown by day accumulated for weekly tracking
It accumulates for every single day, the hours assigned to each resource, including their share of the teams they are in, and then displays those hours every week for each resource, going out up to 2 years. It also provides you with a line chart for every role, so that you can immediately see peaks and troughs and where they fall in your plan’s schedule. There’s some added sophistication in that it even sweeps up those hours left over in incomplete tasks whose end date has expired, and spreads them over this week and next week, automatically. So then you can see if falling behind is putting other tasks at risk.
Baselining
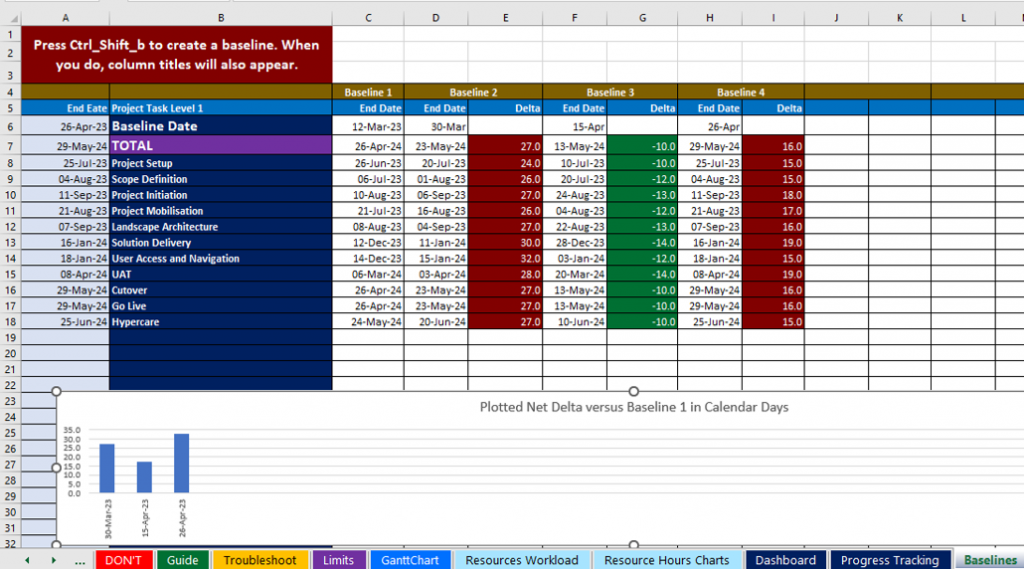
Run a macro in a second to create a snapshot baseline of end dates for overall and task levels 1 and 2. Track the deltas in an automatically augmented table, with an accompanying bar chart for the overall that tracks net delta from baseline 1.
- Less time managing and updating your plan
- Less time on manual reporting and admin
- More quality time to protect the success of your project
- Delight your stakeholders with automated, professional and insightful reporting
- Be in full control of your plan, your resources, your stakeholder management and your project
Resource Utilisation
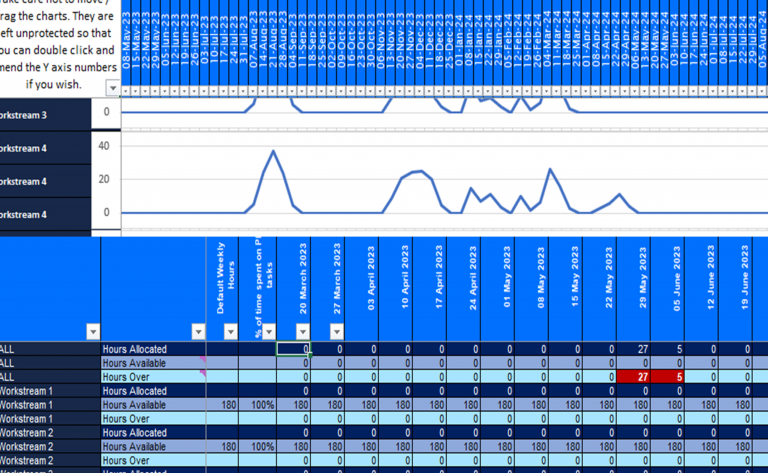
The line graphs you see update real-time based upon your plan content for every resource, so that you can identify peaks and troughs you may want to address to smooth out your resource workload. Once you have configured available hours per resource, you get the real-time data that tells you for each week and resource if the hours exceed available, and it even highlights those where the excess is greater than 5 hours.
Simple and guided configuration
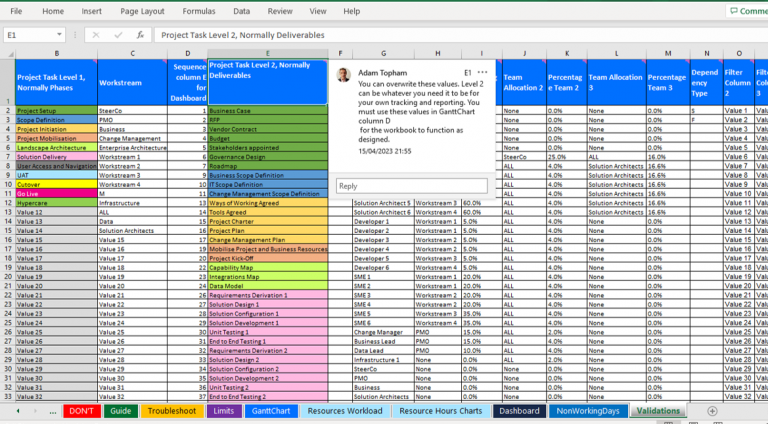
Most of the configuration you need to perform is in one Validations tab and all of the set-up is fully explained with guidance notes at your fingertips.
Other than this tab, there’s a place to simply list non-working days and it even comes with weekend days optionally automatically calculated for your project duration based on your start date.
The only other configuration is the input of default weekly hours and % of that time spent on plan activities, in the Resources Workload tab.
Detailed Instructions
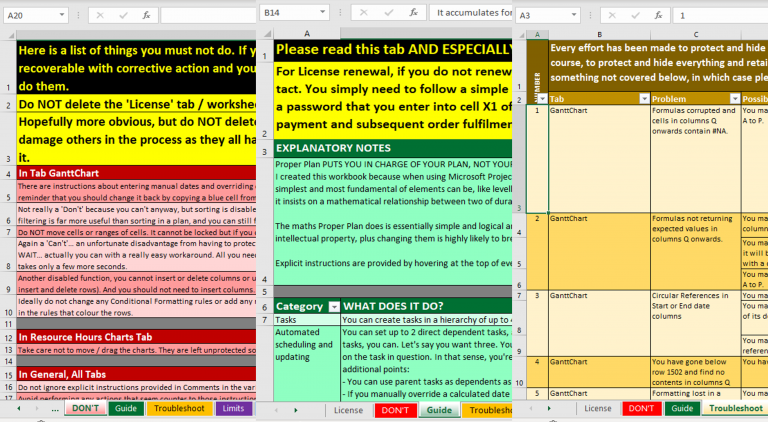
There’s a ‘Dont’s’ tab that informs you of a few things that can’t be prevented but that you should not do. It’s a short list because the workbook is well-protected where it can be without compromising your experience.
There’s a ‘Guide’ tab with comprehensive instructions about how to use Proper Plan, even a recommendation about the sequence in which you should execute the various steps.
There’s a ‘Troubleshoot’ tab that tells you how to resolve quickly, most of the few issues you might encounter. There are also some automatic amber and red cell shadings, some to indicate an error you need to correct and others to indicate you’ve overwritten a formula with a value that you might want to re-automate later.